Welcome to Orca Energy Group’s investor centre
Share Price
Last updated
Q3 2022
Financial highlights
-
$30.5 million
Revenue
-
92.1 mmscfd
Daily average gas delivered & sold
-
$93.1 million
Cash and cash equivalents
2021 Online Summary
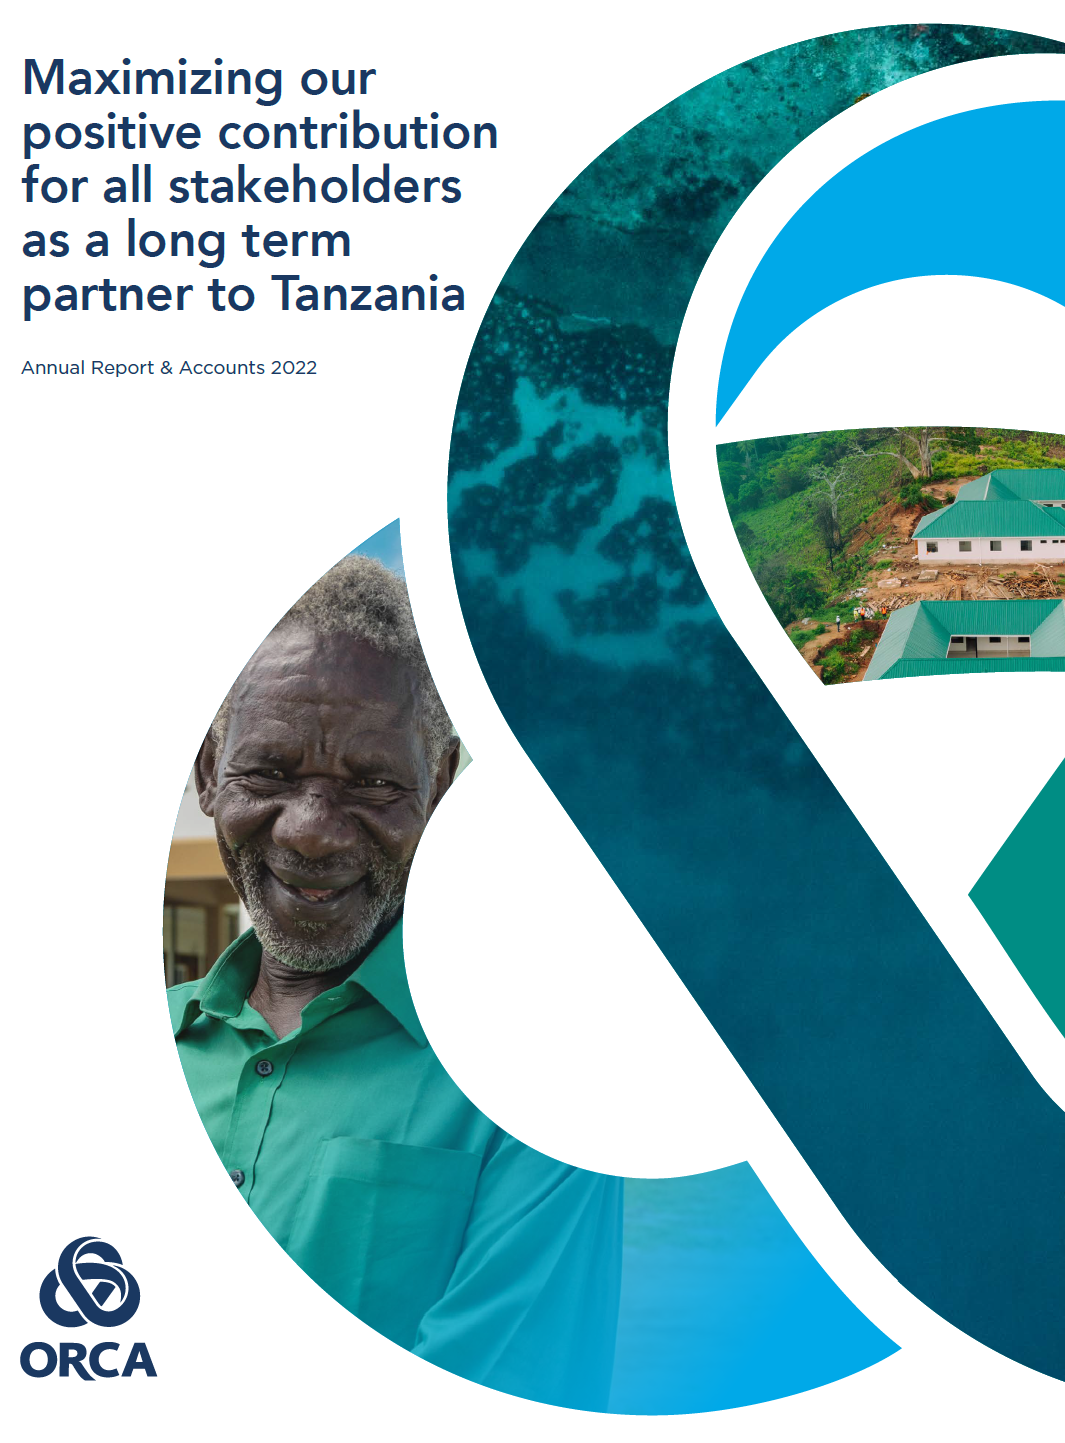
“The Company’s commitment to supporting Tanzania with the provision of power, but also by making a positive impact to the economic and social fabric of the country, remains at the heart of our core ethos.”
Jay Lyons, Chief Executive Officer


Latest reports & presentations
-
Q1 Report 2026
Quarterly Reports
-
Annual Report 2025
Annual Reports
-
Notice of Annual General Meeting 2026
Annual Reports
-
Proxy Circular 2026
Annual Reports
-
ESTMA Report 2025
ESTMA Reports
-
Q3 Report 2025
-
Q2 Report 2025
-
Corporate Presentation, May 2025
Presentations
-
ESTMA Report 2024
ESTMA Reports
-
Notice of Annual General Meeting 2025
Annual Reports